43 KiB
| title | abstract | author | link-citations | documentclass | fontsize | figPrefix | tblPrefix | geometry | urlcolor | header-includes |
|---|---|---|---|---|---|---|---|---|---|---|
| Effects of interdiffusion on shear response of semi-coherent {111} interfaces in Ni/Cu | Alex Selimov, Kevin Chu, David McDowell | true | article | 12pt | Fig. | Table | left=3cm,right=3cm,top=2cm,bottom=2cm | blue | \usepackage{bm} \usepackage{amsmath} |
Introduction
Nanolaminate composites exhibit properties that exceed those of the constituent materials as a result of the high density of interfaces present, resulting in improved yield strength, fatigue strength, radiation tolerance, and other mechanical properties [@zhu_tensile_2009; @Zhang_2012; @MISRA2006146; @Cao_2019; @S_enz_Trevizo_2020; @zhou_mechanical_2015]. These properties can be tailored through control of layer thickness [@banerjee_influence_2001; @zhang_length-scale-dependent_2011; @Snel_2017], modulation ratio [@Carpenter_2012; @zhang_modulation_2015], and through adjustment of interface properties, such as misfit dislocation density [@Zhang_2017a; @An_2019; @Yang_2020]. The interfaces play a fundamental role in the material plasticity controlling the generation of defects [@2013a;@wang_interface_2014], propagation of slip [@Xiang_2018; @1999a; @wang_atomistic_2008], and crack growth [@li_role_2018;@Zhou_2018]. Computational studies of nanolaminates aid in filtering the parameter space at a lower monetary/time cost than experimental studies and can determine prospective parameter combinations for improved material properties. In the model forms used for such studies, a balance must be struck between the use of assumptions to simplify the problem and the associated reduction in accuracy. Computational studies of nanolaminate materials commonly assume atomically sharp interfaces [@cheng_misfit_2007;@fu_molecular_2016; @Yin_2019;@Shao_2013a]. This assumption generally does not hold for interfaces in real nanolaminates due to interdiffusion of chemical species as a result of manufacturing processes [@Saito_1999; @Sun_2020; @Zhang_2020, @verdier2001some; @Yan_2016,@Jankowski_2007;@Nasim_2019]. These diffuse interfaces, generated through interdiffusion, complicate the interface structure and it's evolution under loading. However, it also opens the possibility of tailored interface structures enabling designer nanolaminate materials with targeted mechanical responses such as in Cu/Ni nanolaminates manufactured through sputtering [@2018]. Control of nanolaminate layer compositions has been shown for Cu/Ni multilayers manufactured through sputtering by the application of annealing treatments [@Yan_2016]. There is a need to characterize more realistic interface structures to improve predictions of nanolaminate properties and ultimately aid nanolaminate design.
Interfaces in nanolaminate materials can be broadly grouped into coherent, semi-coherent, or incoherent interfaces which interact differently with lattice dislocations [@mastorakos_deformation_2009]. Semi-coherent interfaces form when both constituents have compatible crystal structures and layer thicknesses are above a material specific critical value [@rao_atomistic_2000]. They are characterized by a network of misfit dislocations where their spacing depends on the lattice constant mismatch between constituent materials. These misfit dislocations resist slip transmission across the interface by reacting with incoming lattice dislocations [@dikken:hal-01572509;@Xu_2020]. The originating/terminating points for misfit dislocations, also referred to as misfit nodes, primarily contribute to the interface plasticity by serving as lattice dislocation generation points [@Shao_2015] and initiation sites for interface sliding [@Selimov_2021; @Yang_2020; @Chen_2018]. While the atomically sharp semi-coherent interface between Cu/Ni has been well studied, the effects of interdiffusion on interface properties/evolution and the resulting impact on the overall nanolaminate properties requires further investigation.
Interdiffusion has two primary effects on semi-coherent interface structure. The first is the adjustment to the bulk layer lattice parameters which leads to a lower misfit dislocation density than in the pure case. Experimental studies have noted shifts in lattice parameter for nanolaminate layers, measured through x-ray diffraction, with annealing and interdiffusion [@Jankowski_2007; @Moszner_2016; @Chl_dek_1996; @Hollanders_1990]. Misfit dislocation density is an important parameter, as work by Yang et al. [@Yang_2020] finds that the shear response of an interface can be connected to the misfit dislocation density, i.e. a higher misfit dislocation density is required for a larger shear strength. Work by Xu et al. [@Xu_2020] showed that a higher misfit dislocation density was associated with a higher interface resistance to slip transmission. Larger misfit dislocation spacings resulting from interdiffusion potentially decrease the interface resistance to slip transmission and the shear strength of the interface.
The second effect that interdiffusion can have on the interface structure is the presence of solute atoms which may serve as dislocation generation sites or as pinning points for interface misfit dislocations [@Wang_2020]. Generally, solutes impede dislocation motion through solute segregation to dislocation lines [@Pascuet_2019] or solute strengthening due to concentration fluctuations in a random alloy [@Varvenne_2017]. Molecular dynamics studies on the effects of Ni solutes on dislocation mobility in Cu/Ni solid solutions reveal two primary regimes. At intermediate stress, the Ni solutes serve to impede dislocation motion while at higher stresses, at which point dislocation velocities begin to saturate, the Ni solutes serve to increase the dislocation velocity [@Bryukhanov_2020]. The barrier for cross-slip of screw dislocations is also reduced in random substitutional alloys due to the concentration fluctuations [@N_hring_2017]. Dislocation generation from semi-coherent interfaces due to Friedel-Escaig-like cross-slip of misfit dislocations has been reported in the literature [@Chen_2018]. Solutes at the interface may act to impede misfit dislocation motion through a solute-drag like effect [@1976] inhibiting interface sliding and increasing shear strength while simultaneously easing dislocation generation from the interface and reducing yield strength.
Determination of how these two competing effects affect interface properties requires atomistic simulations as the interaction between misfit density and solute effects alter atomic level restructuring pathways. The literature shows some studies on the effects of alloying and interdiffusion on the properties of semi-coherent interfaces. Work done by Gola et al. [@Gola_2018] found that alloying Cu layers with Ag in Cu/Ni bicrystals led to an increased resistance to both shear and slip transmission due to an increased misfit dislocation density as a result of an increase in lattice mismatch. Wang et al. [@Wang_2020] studied the misfit dislocation structure of Ag/Cu bicrystals after alloying each individual layer with the other species. They found a reduction in the yield stress as a result of increased alloying, a change in the dislocation generation site from the misfit dislocation nodes to points of impingement between solute clusters and misfit dislocations, and an increase to the interface shear resistance due to solute pinning of misfit dislocations. Limitations in this work pertain to the fact that relatively low solute concentrations were studied, differences in misfit dislocation density between investigated geometries were small, and that alloying was done in only one of the two layers. Interdiffusion in Cu/Au bicrystals was found to result in the development of a 3D dislocation structure at the diffuse interface from the initial 2D semi-coherent interface misfit structure [@gola2018structure], however mechanical properties of these interfaces were not studied. There is a need for studies of bicrystal geometries with diffuse interfaces at different levels of interdiffusion to characterize the effects of misfit dislocation density and solutes on interface properties.
This work seeks to elucidate the effects of interdiffusion on the interface misfit dislocation structure and interface shear response. Molecular dynamics (MD), molecular statics (MS), and Monte-Carlo (MC) methods are used to study the effects of solutes and decreased layer misfit on the properties of semi-coherent interfaces in the Cu/Ni system. Solute concentrations of up to 30% in each layer are studied. First the methodology and geometries used to study the effects of interdiffusion induced interface structure on the properties of the material are presented. The characterization of the interface structure and the solute distribution follows. Finally, the effects of solutes and adjusted misfit dislocation spacing on shear properties are discussed with a focus on interface sliding. This work highlights the importance of accounting for interdiffusion induced interface structures for accurate modeling of nanolaminate materials.
Methodology
Geometries under investigation and simulation conditions
![a) Image of model geometry with 1% solute concentration. All investigated geometries have the same orientations. b) Common neighbor analysis of the interface structure with overlaid misfit dislocation lines computed via the Dislocation Extraction Algorithm [@stukowski_dislocation_2010]. Misfit dislocation density decreases with increasing solute concentration.](/git/aselimov/interdiffusion_paper/media/branch/master/img/methodology.png) {#fig:methodology}
{#fig:methodology}
One of the model geometries under investigation in this work alongside the interface structures are presented in [@fig:methodology].
Geometries are generated over several steps using in house codes.
To account for the changes in the lattice parameters of the layers expected from interdiffusion of species, a rule of mixtures is used to calculate the lattice parameters for each of the nanolaminate layers.
Blocks of Cu/Ni solid solutions are generated by first creating pure blocks of Cu and Ni with the correct concentration dependent lattice parameter, shown in [@tbl:parameters].
Atoms are then randomly swapped to the opposite type until the desired solute concentration is achieved.
In this work the solute concentrations are set to the same value in both layers.
The two blocks of Cu/Ni solid solutions are then combined along the [11\bar{1}] direction to form a semi-coherent interface.
This process generates a random distribution of solutes; however, solute concentrations are expected to be higher at interfaces [@Roussel_2006].
Layer Concentration Lattice Dimensions Number of Misfit Constants Atoms Spacing
Cu/Ni 3.615/3.524 \AA 51.2 x 29.6 x 36.9 nm 4,971,060 10.1 nm
Cu${.99}Ni{.01}/Ni{.99}Cu{.01}$ 3.615/3.524 \AA 51.2 x 29.6 x 36.9 nm 4,971,060 10.1 nm
Cu${.9}Ni{.1}/Ni{.9}Cu{.1}$ 3.606/3.533 \AA 42.7 x 24.7 x 36.9 nm 3,457,800 12.2 nm
Cu${.8}Ni{.2}/Ni{.8}Cu{.2}$ 3.597/3.542 \AA 57.2 x 33.0 x 36.9 nm 6,178,320 17.0 nm
Cu${.7}Ni{.3}/Ni{.7}Cu{.3}$ 3.588/3.551 \AA 43.0 x 24.8 x 36.9 nm 3,492,900 26.2 nm
: Parameters for geometries under investigation. {#tbl:parameters}
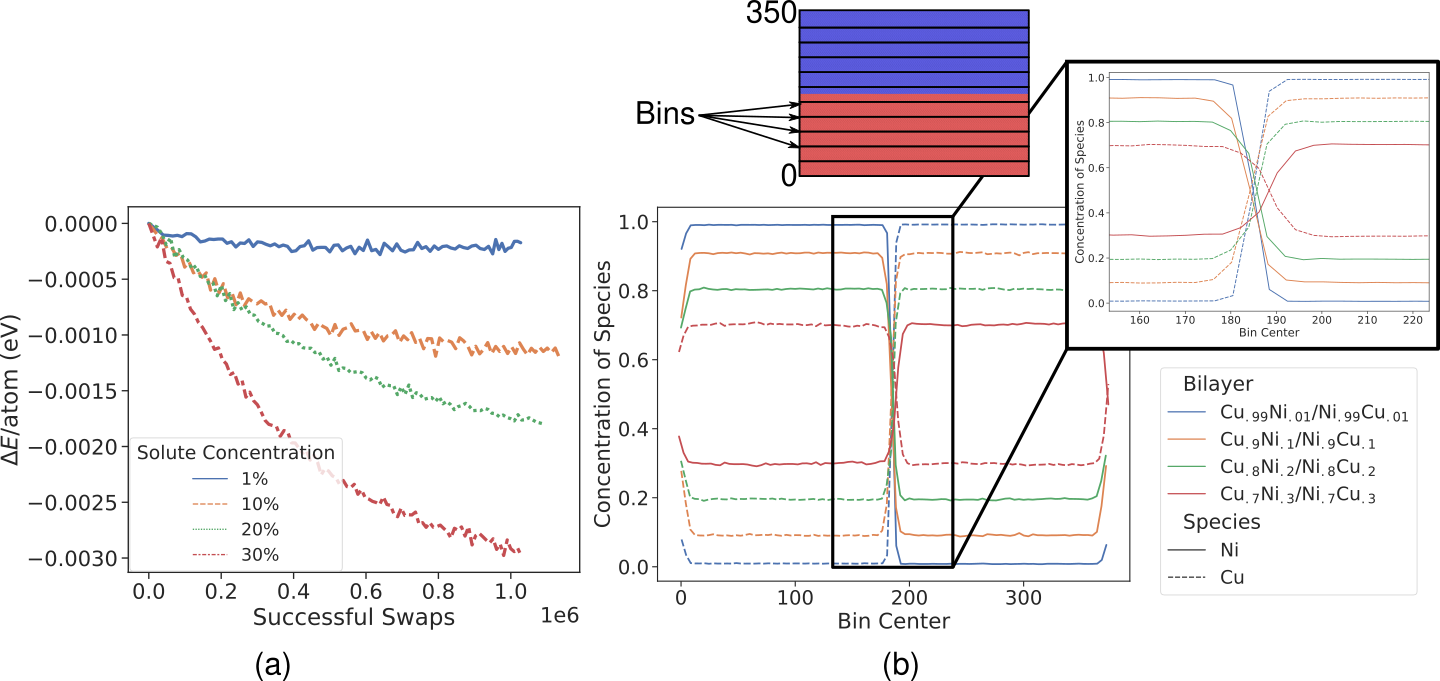
To obtain a more accurate solute distribution, a hybrid MC/MD scheme, conducted with the Lammps simulation code [@Thompson_2022] is used. First the interface structure is minimized using sequential conjugate gradient and FIRE [@bitzek_structural_2006] steps with increasing force tolerances. During the conjugate gradient steps, the strain energy of the system, calculated by the Parrinello and Rahman expression [@parrinello_polymorphic_1981], is minimized using built in Lammps options. After the interface structure is properly minimized, the hybrid MD/MC scheme is applied. First the system is initialized to 700 K by applying a scaled gaussian velocity distribution and then relaxed using an NPT ensemble over 10 ps. Following the relaxation, an additional 100 ps of dynamics in an NPT ensemble is conducted. Every ten iterations, or 0.01 ps, two hundred attempts are made at swapping the types of two atoms in the system. To maintain the prescribed solute concentration in each layer, the swaps attempts are restricted to two atoms within the same layer. In total two million swaps are attempted, one million per layer. This is a relatively low number of swaps compared to the overall model size. Initial solute structures therefore may not correspond to the fully energy minimized ones, specifically considering the extent of solute segregation to misfit dislocations. Analysis of model deformation, however, is not restricted to only the initial interface sliding. The effect of initial solute structure on subsequent interface sliding or yielding occurring after deformation of the misfit pattern away from the initial position should not be significant. Overall interface solute concentration is therefore more important, and the concentration profiles for the investigated geometries shown in [@fig:swaps_and_profile]b) exhibit increasing solute concentration with proximity to the interface as expected [@Roussel_2006]. Convergence of the system energies with successful swaps can be approximated by the change in energy per atom, as seen in [@fig:swaps_and_profile]a). Observed fluctuations in the energy arises from the thermostatting process. The change in energy per atom meets a tolerance of 1e-6 eV/atom. Increased number of atomic swaps were not possible due to the computational cost.
 {#fig:swaps_and_profile}
Periodic boundaries are used in all dimensions, approximating an infinite nanolaminate system with some constraint imparted by the periodic boundaries. To ensure periodicity along the in-plane dimensions, the length of the simulation cell is set to a value which is a multiple of the lattice repeat distance for both layers. Because the lattice repeat distance depends on the lattice constant, the model dimensions must be different for each solute concentration. Efforts were taken to select the most similar dimensions, but variation in both in-plane dimensions is noted. This work utilizes the Onat and Durukanoǧlu Cu/Ni potential [@onat_optimized_2014] due to their focus on fitting the Cu-Ni interaction term leading to improved accuracy of calculated mixing enthalpies compared to other EAM potentials. It is also noted that because the lattice mismatch between Cu and Ni is small, the differences in the lattice constants between the different alloys studied is also small. As a result, although the solute misfit volume is not constant between the different investigated geometries, the differences are small enough to be considered negligible. In systems where the lattice constant mismatch is large this may not necessarily hold and the dependence of solute strength, through the atomic misfit volume, on the layer solute concentration may need to be considered. Models are analyzed using Ovito [@Stukowski_2009] with the built-in Dislocation Extraction Algorithm (DXA) [@stukowski_dislocation_2010] used to determine positions and Burgers vectors of interface misfit dislocations. The potential contribution to the virial stress [@zhou_new_2003] is used to calculate the stress of the models and is referred to as the interatomic potential stress for clarity.
Kevin please add information about shear simulation here
Microrotation vector analysis of interface deformation
 {#fig:micro_comparison}
In addition to commonly used metrics for analysis of atomistic models, such as Common Neighbor Analsyis (CNA) [@honeycutt1987molecular], the microrotation vector is also used to reveal in more detail the interface deformation. The microrotation vector is defined as [@Tucker_2009; @Tucker_2011],
\phi_k = -\frac{1}{2}\varepsilon_{ijk}(R_\textrm{skew})_{ij} Where \varepsilon is the permutation symbol and R_\textrm{skew} is the skew symmetric part of the rotation tensor in the right polar decomposition of the deformation gradient, i.e.,
\pmb{F}=\pmb{RU}Analysis of the atomic microrotation vector has been previously applied to the Cu/Ni semi-coherent interface [@Selimov_2021] elucidating both magnitudes and directions of atomic restructuring associated with interface sliding. Components of the microrotation vector describe the rotation of lattice vectors attributed to deformation such as dislocation slip, grain boundary sliding, or the glide of interface misfit dislocations. Microrotation vector magnitudes reflect the degree of restructuring with distinct values quantified for a variety of deformation processes such as dislocation glide and grain boundary migration [@Tucker_2011]. The interested reader is referred to the previously mentioned works by Tucker et al. [@Tucker_2011] for a more in-depth description of the calculation of the microrotation vector.
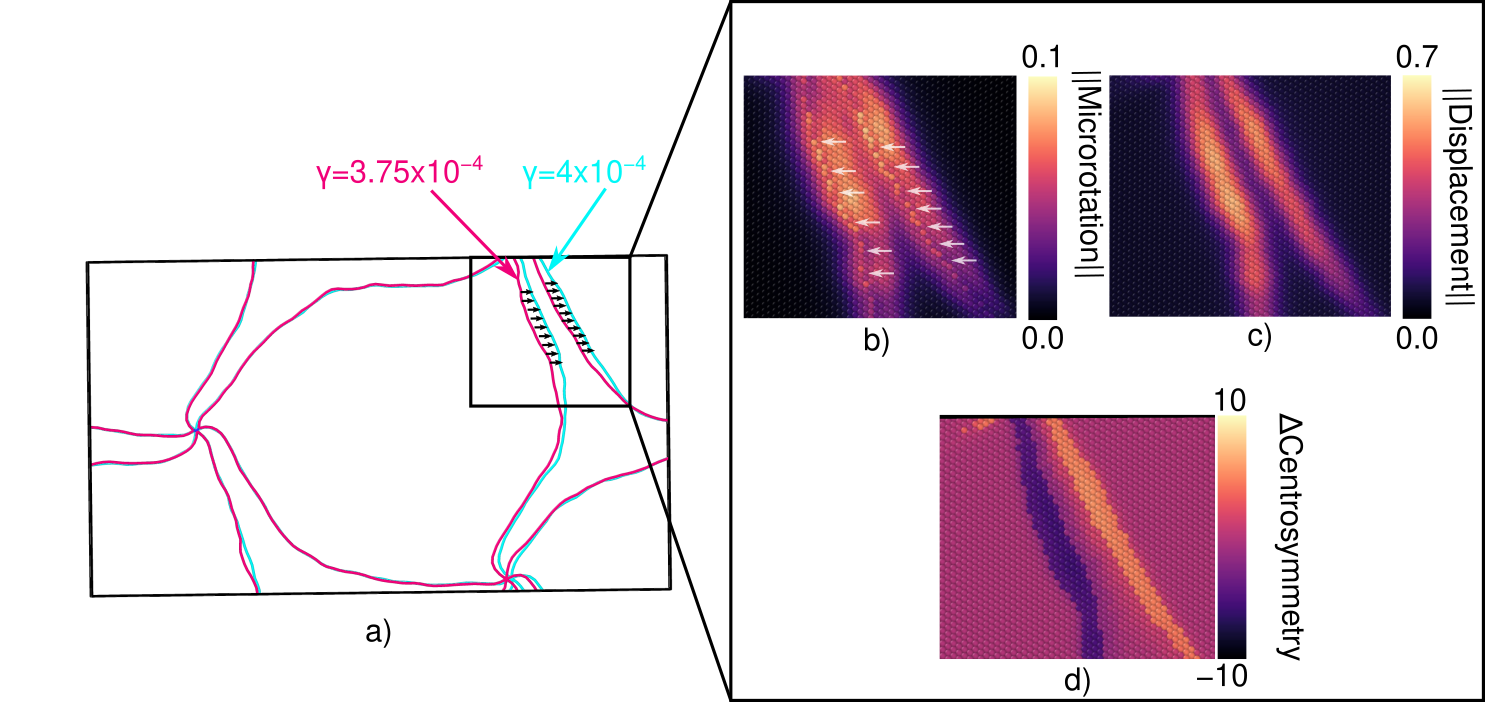
The microrotation vector, atomic displacement vector, and change in centrosymmetry are compared in [@fig:micro_comparison] as metrics to analyze the evolution of the interface misfit dislocation pattern between after shearing for the 30% solute concentration model. The microrotation vector shows lines of lower microrotation corresponding to the shift from the initial dislocation position to an fcc crystal structure, which requires less complex deformation then the transition from fcc to hcp which are observed as regions with higher microrotation vector magnitudes. The displacement vector magnitude is distributed smoothly as observed in [@fig:micro_comparison]c) complicating the demarcation of regions that have undergone structure change. This is because affine deformation of the atomic structure affects the value of the displacement vector and because the displacement vector does not consider the local atomic structure. The change in centrosymmetry parameter, [@fig:micro_comparison]d), is able to capture changes to atomic crystal structure well but does not capture the longer range deformation fields associated with the local structure changes. The microrotation vector thus serves as a powerful tool for analyzing the interface deformation.
Excess volume analysis for tracking node positions
 {#fig:excess_volume_schematic}
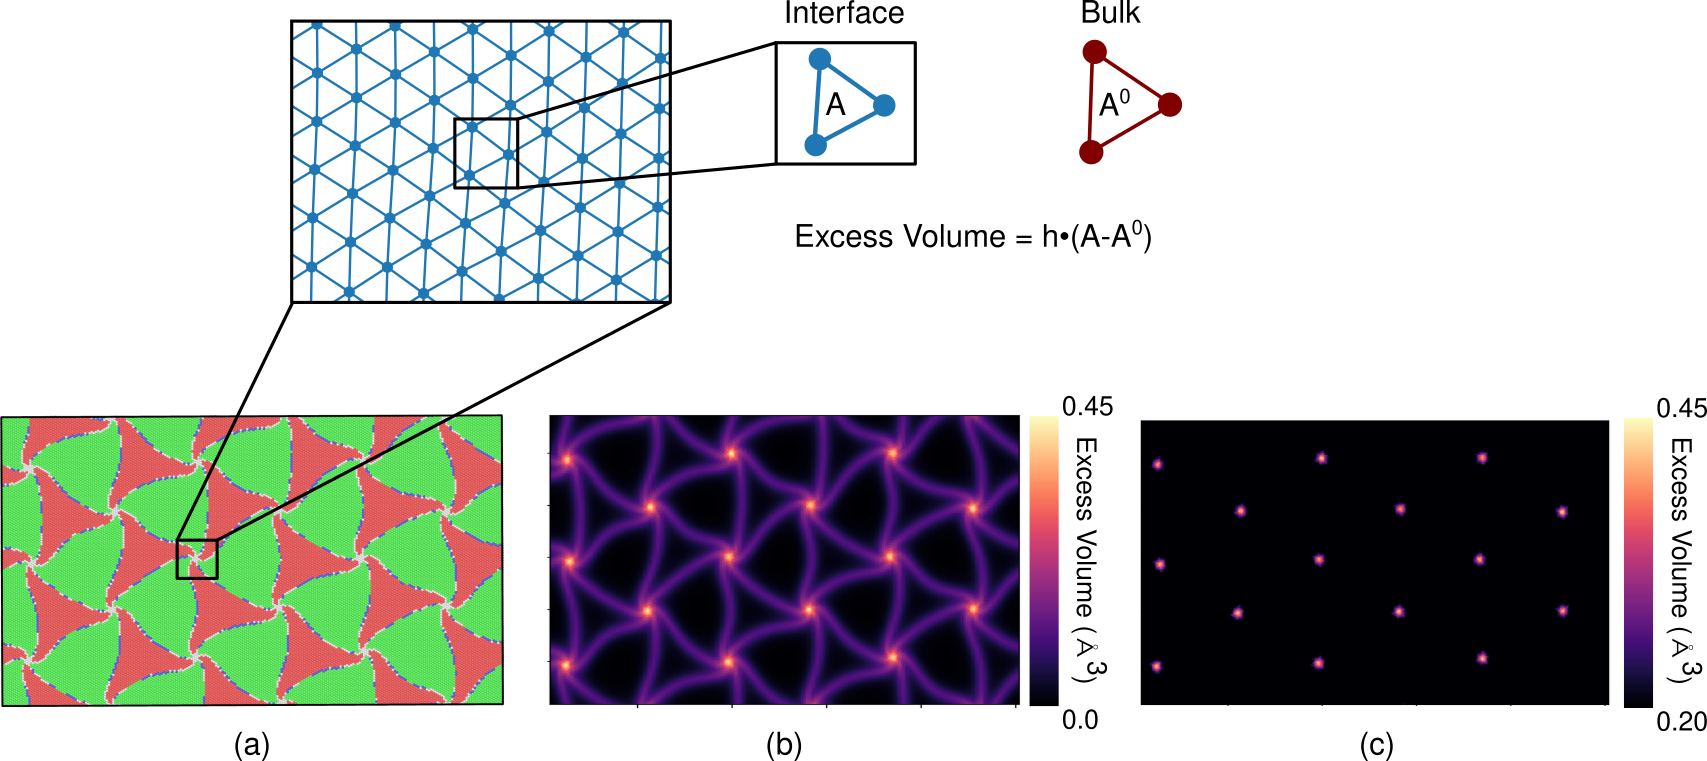
It is desirable to track misfit node displacement to numerically characterize interface motion. Misfit node displacement can then be compared to local deformation to understand the differences in interface sliding pathways. For this purpose excess volume analysis, as originally presented by Shao et al. [@Shao_2015], is combined with a K-Means clustering algorithm [@scikit-learn] to determine the centroids of excess volume regions associated with misfit nodes. The excess volume analysis uses a Delaunay Triangulation [@Virtanen_2020], as shown in [@fig:excess_volume_schematic]. The area of each triangle in the mesh is calculated. The area associated with the alloy in bulk can be calculated using
A^0=\frac{\sqrt3}{4}b^2_{\textrm{perfect}}where the burgers vector (b_\textrm{perfect}) used is calculated from the lattice constant prescribed to the layer.
The area in bulk is subtracted from the area at the interface and then multiplied by an atomic layer height (h) to obtain the excess volume plots, such as the one presented in [@fig:excess_volume_schematic]b).
Excess volume is defined for each of the triangles in the mesh.
To determine the misfit node position, triangles with excess volumes below 0.2 \AA$^3$ are removed.
The centroid of the remaining triangles, which form clear groups at the misfit nodes as shown in [@fig:excess_volume_schematic]c), are then clustered using a K-Means clustering algorithm.
The centroids of these clusters correspond to misfit node centroid position and can be tracked with applied loading.
Results and Discussion
Investigation of solute clustering and solute segregation at the Cu/Ni interface
 {#fig:partial_gr}
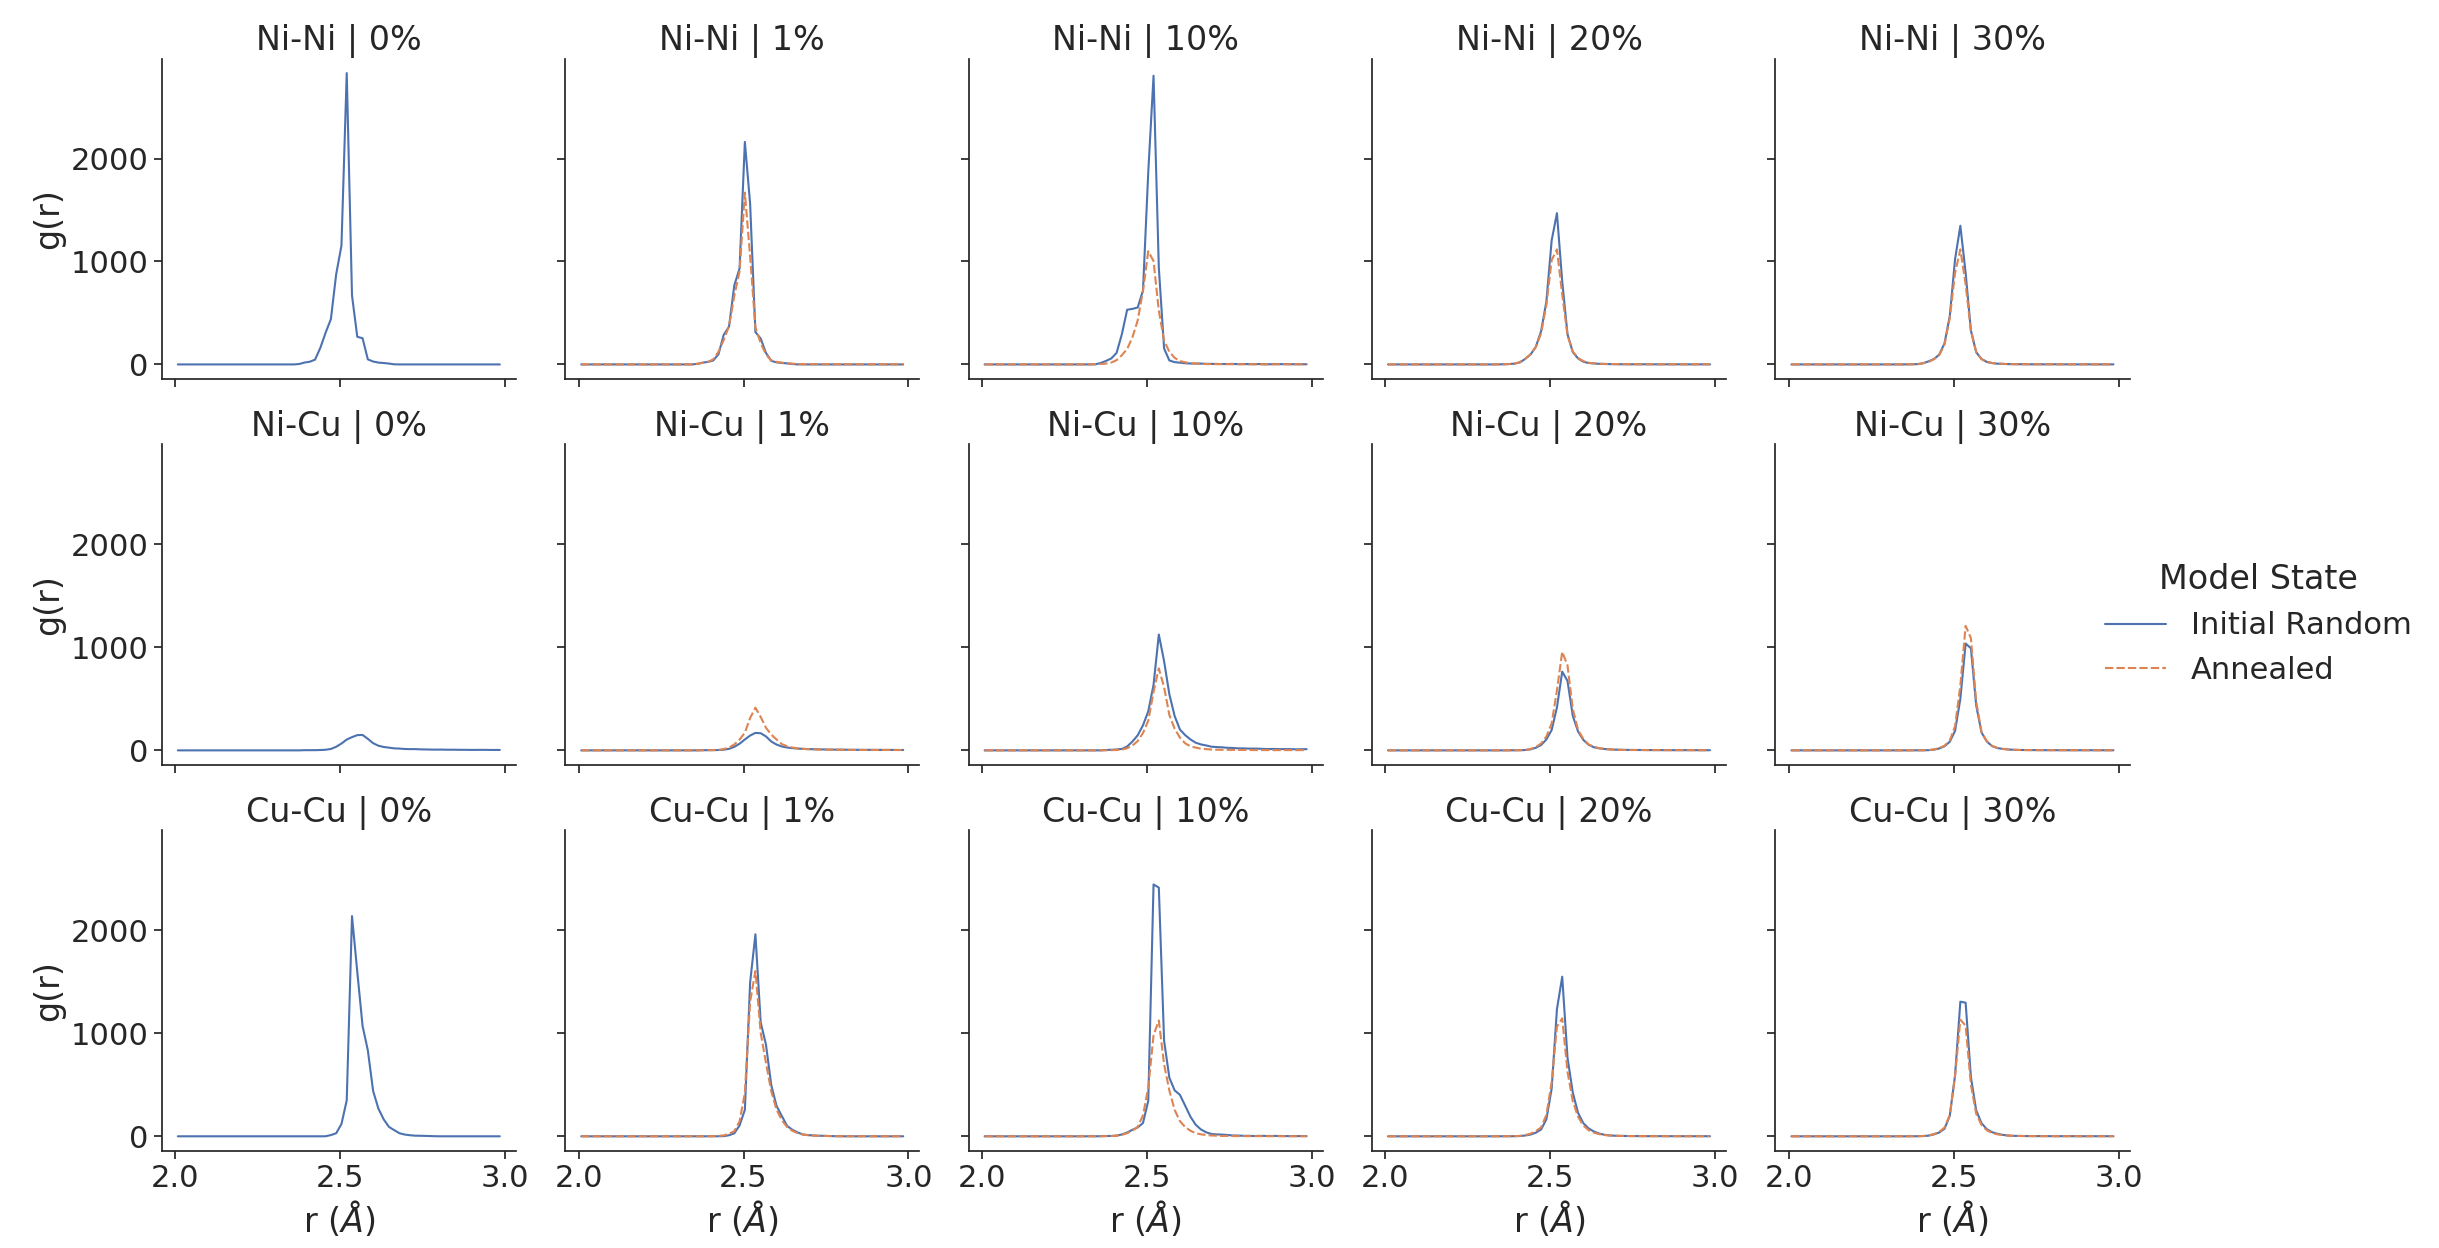
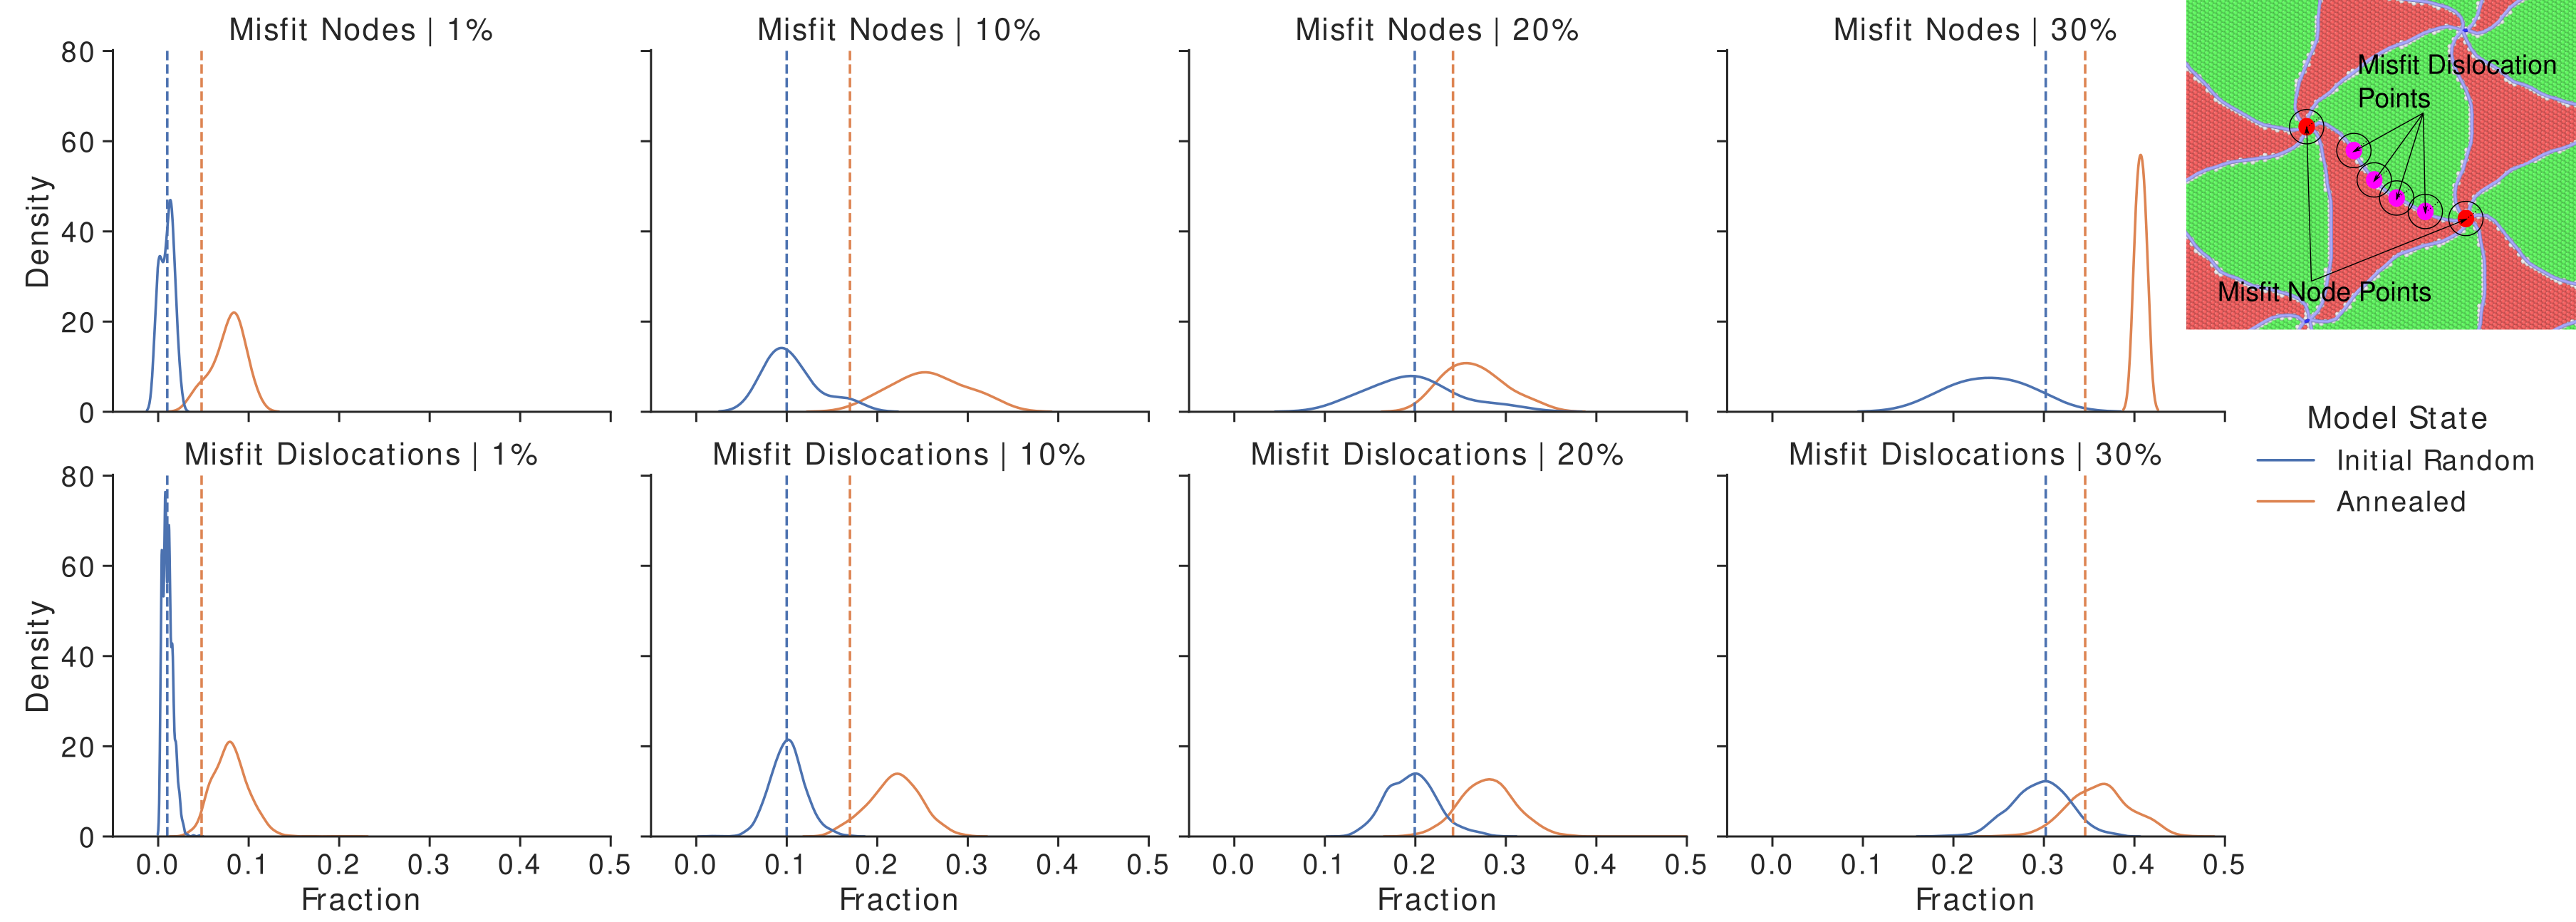
All interface structures presented in [@fig:methodology]b) exhibit the well established spiral pattern associated with the Cu/Ni semi-coherent interface [@Shao_2013]. Characterization of interdiffusion induced interface structure requires characterization of both solute clustering and solute segregation at the interface. Partial radial distribution functions calculated for all concentrations are presented in [@fig:partial_gr]. These partial radial distribution functions are calculated for interface atoms only and show that the hybrid MC/MD procedure generally leads to increased intermixing of chemical species. Clustering is not promoted by the annealing process for the investigated geometries. Additionally it is expected that solutes will segregate to misfit dislocations at the interface due to the associated excess volume. To characterize this segregation, the Dislocation Extraction Algorithm (DXA) [@stukowski_dislocation_2010] is utilized to calculate points along the misfit dislocation lines. Interface atoms within a radius of 15 \AA\ of these points are then determined and the fraction of those atoms which are solutes are calculated. This process is repeated for interface atoms near misfit dislocation nodes. Kernel density estimation is used to approximate the distribution of the solute atom fraction for all sampled points along the misfit dislocation lines.
 {#fig:solute_fractions}
The fraction of solute atoms near misfit dislocation lines generally and misfit dislocation nodes specifically are compared to the overall interface solute fraction in [@fig:solute_fractions]. It is observed that the atomic neighborhoods near misfit dislocation have higher solute fractions than the overall interface. This confirms solute segregation to the misfit dislocation lines. The misfit dislocation nodes have similar fractions of solute atoms in surrounding atomic neighborhoods as fractions near misfit dislocation lines. The low standard deviation of the distribution for the 30% solute concentration annealed model is attributed to the small number of misfit nodes included within the geometry, necessary as a result of the very large misfit spacings. The standard deviation for post-anneal solute fractions calculated for points along the misfit dislocation lines is approximately 0.02 for the 1% solute concentration model and 0.03 for the other solute concentrations. This non-uniform solute segregation is expected to lead to a distribution of energy barriers for misfit dislocation glide as solute drag forces [@Mishin_2019] increase with increasing solute concentration as does the extent of pinning by solute configurations [@Olmsted_2005]. This is discussed in more detail in the following sections on the response of investigated geometries to applied shear.
Effect of solute concentration on interface shear strength and misfit node glide
 {#fig:shear_stress_strain}
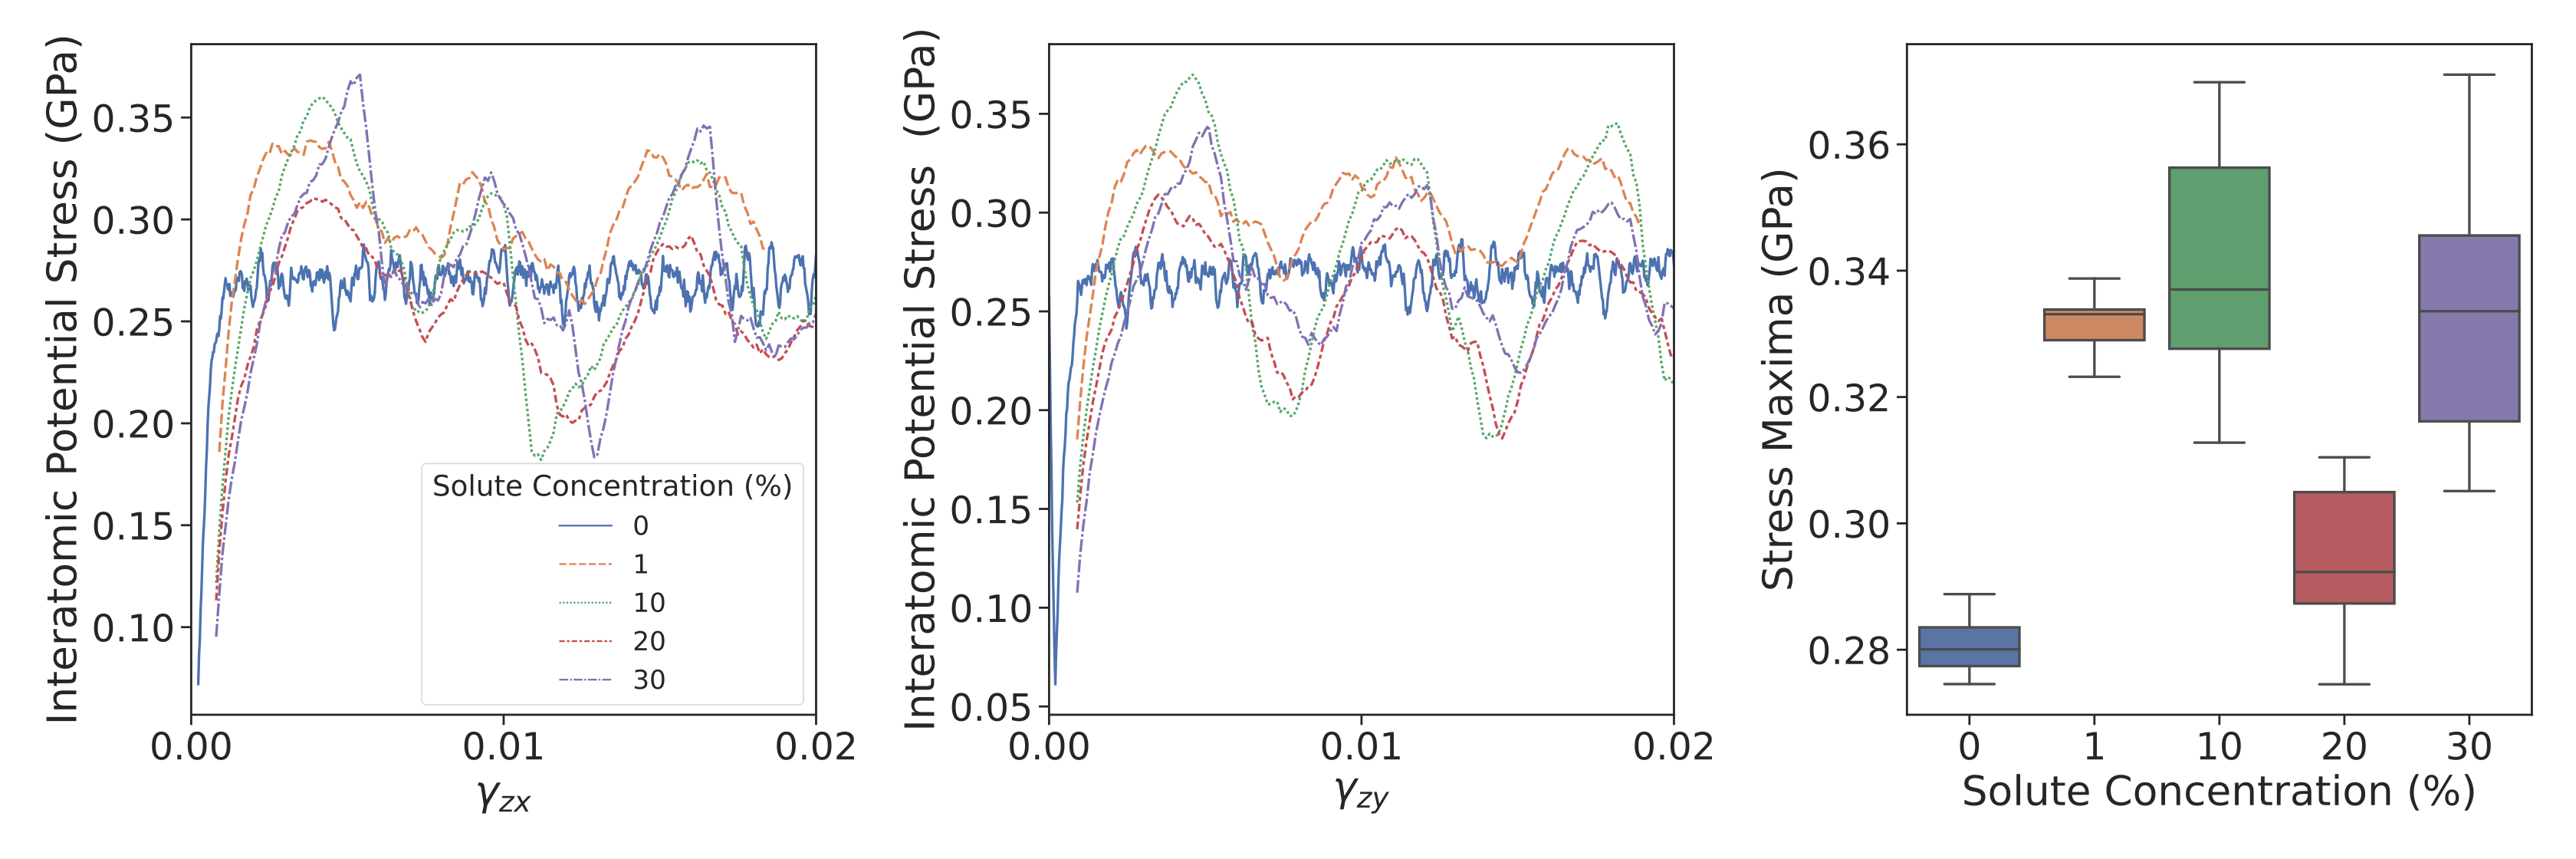
Stress-strain curves for the investigated geometries under shear loading are presented in [@fig:shear_stress_strain]a-b). It is observed that the presence of solutes increases the interface shear strength and resistance to sliding relative to the atomically sharp case as observed by the increase in the average stress maxima in [@fig:shear_stress_strain]c). The spread of stress maxima values also increases, with the 30% model having the largest spread of approximately 0.07 GPa. Neither average nor median stress maxima values show a clear trend with overall solute concentration. This may result from the competing effects of increased solute concentration, which improves interface shear strength [@Wang_2020], and the reduction in misfit density, which is associated with reduced shear strength [@Yang_2020]. The spread of maximum stress values results from the various solute configurations encountered by the misfit dislocation pattern as interface sliding occurs. These differing solute configurations offer different resistance to misfit dislocation glide and non-uniform strengthening. The various solute configurations encountered may also result in the lower minimum stress values observed for the models with solutes present compared to the 0% solute concentration model. As the misfit dislocations overcome solute configurations with higher resistance to interface sliding, a significant amount of stress is relaxed as the misfit pattern glides over regions of the interface with lower resistance to sliding. The period of the oscillations observed in [@fig:shear_stress_strain]a-b) suggests that interface sliding does not occur uniformly. In the case of the 0% solute concentration model, the stress builds up to the maximum value and is relaxed to a minimum value over very few strain steps. In the presence of solutes, the stress build up and relaxation occurs gradually which can be explained by the glide of subsets of the misfit dislocations until they encounter solute configurations which have high resistance to glide. Use of a statistically sampled interface shear strength in reduced-order models, as opposed to an average interface shear strength, more accurately considers the underlying random distribution of solutes at the interface and may lead to improved predictions of real nanolaminate response. Alternative descriptions of the shear strength may be necessary for systems which form ordered patterns of solute clusters at the interface.
It is possible to deduce trends related to the competing effects of solutes and misfit dislocation density on interface shear strength from analysis of the initial yield points observed in [@fig:shear_stress_strain]. Comparison between the models with 0% solute and 1% solute isolates the effects of the solutes on the interface shear strength as the interface misfit densities are identical. For this case it is observed that the presence of solute leads to increased shear strength as expected. The extent that the misfit dislocation density reduces the shear strength cannot be isolated as cleanly. However, it is noted from inspection of [@fig:solute_fractions] that the initial solute concentrations at misfit dislocation nodes are similar for the 10% and 20% models. This is noted to be an artifact of the annealing steps due to the ratio of swaps to total model size being smaller for the 20% solute concentration model which may result in the outlier behavior observed. This again should primarily affect the initial interface sliding, as increases in the overall solute fraction at the interface resulting from the hybrid MC/MD annealing are similar for all investigated models. Because the misfit dislocation nodes initiate interface sliding [@Yang_2020] and because the solute concentrations at the misfit nodes are similar, comparison of the initial interface shear strength provides insight into the role that misfit dislocation density plays. As expected, the decrease in misfit dislocation density leads to a reduction in the shear strength. The cause for this reduction in the shear strength will be discussed in future sections. Further work is necessary to directly isolate these competing effects and to determine the relationship between overall solute concentration and resulting shear strength.
 {#fig:node_disp_strain}
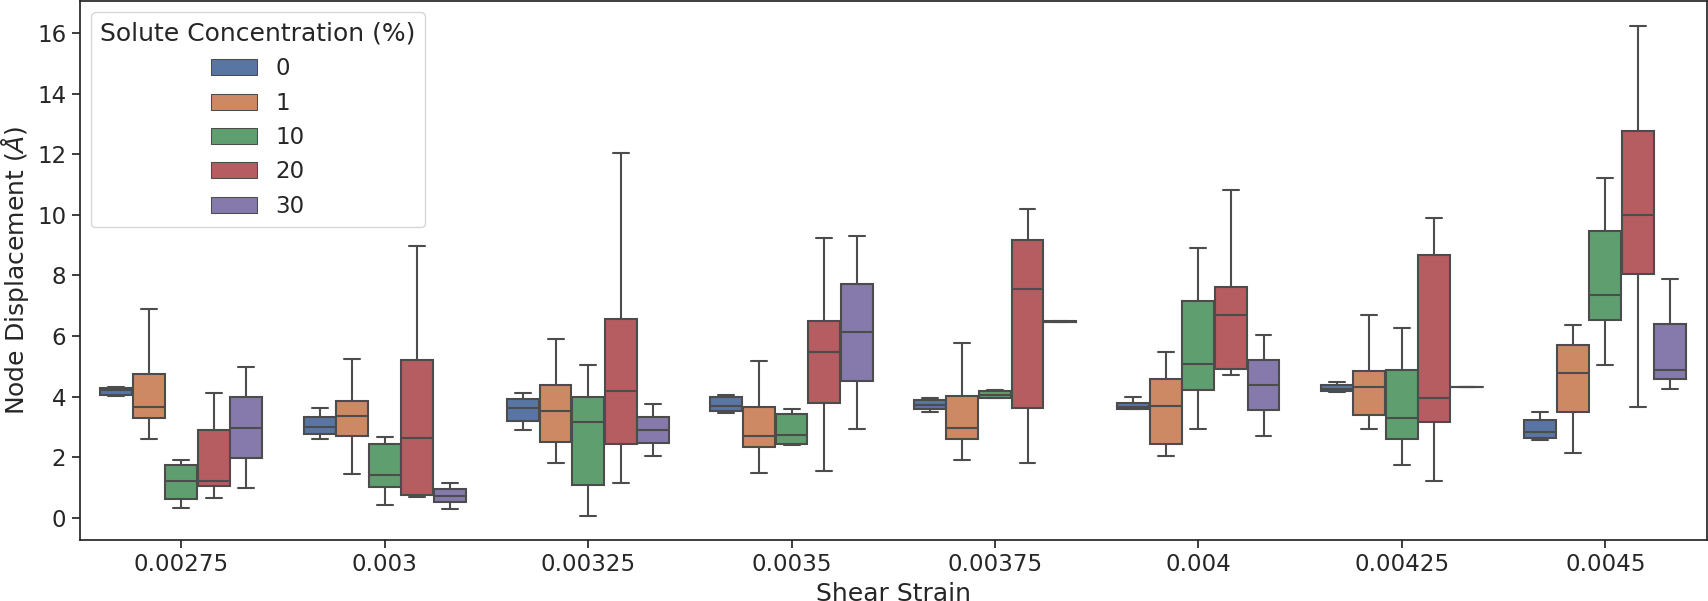
It is possible to track the misfit node displacements by using excess volume analysis to determine misfit node centroids during loading. The displacement as a result of a single strain step increment can then be calculated, and is plotted in [@fig:node_disp_strain] for several strain increments. The 0% solute concentration model exhibits uniform node displacements with all misfit dislocation nodes gliding similar amounts for each strain increment. This is not the case for the models containing solutes. Addition of solutes is observed to increase the spread of node displacements indicating that for any given strain step, only a subset of the misfit dislocation nodes accommodate the imposed strain through glide. This again suggests non-uniform resistance to misfit node glide and piecewise interface sliding. The increased node displacement with larger solute concentrations may result from either of two causes. Either misfit node glide is facilitated by the increasing solute concentration, resulting in larger displacements per strain increment, or that local solute configurations lead to significant variation in the interface resistance to misfit glide and as a result larger node displacements accompany overcoming these regions of locally increased resistance. In reality both causes may be contributing factors as the increase in node displacements between the 0% and 10% solute concentration models corresponds to an improvement in shear strength, while the increase between the 10% and 20% solute concentration models corresponds to a decrease. Analysis of energy changes associated with interface sliding in future sections will discuss this in more detail.
Microrotation vector analysis of interface deformation and activation of misfit dislocation glide
 {#fig:interface_micro width=80%}
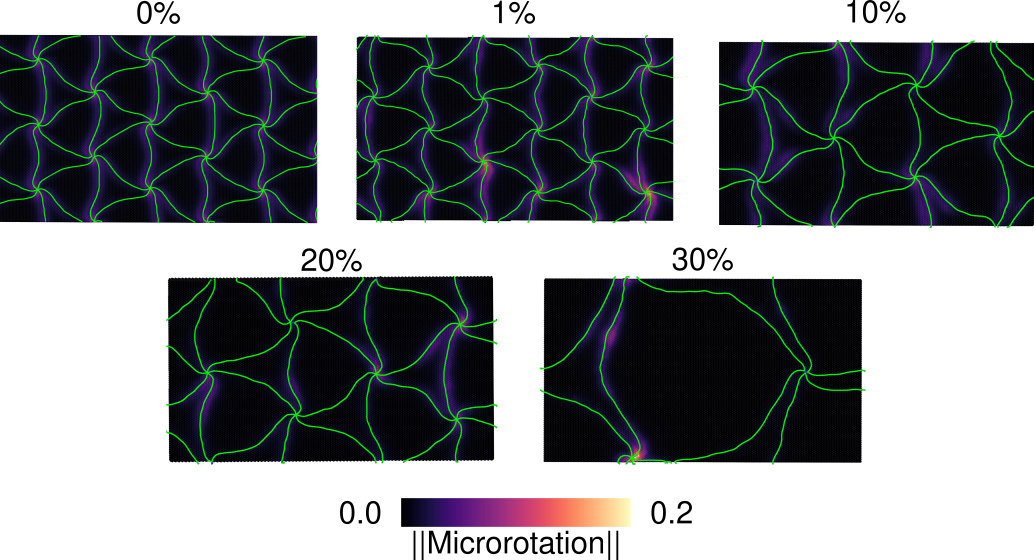
Examples of interface atom microrotation maps are shown in [@fig:interface_micro] for all geometries subject to a shear strain which results in deformation of the interface misfit dislocation pattern. A few observations can be made for the presented geometries. First, the 0% solute concentration model exhibits a uniform distribution of atomic microrotation magnitudes. Maximum values are noted at the misfit nodes accompanied by regions of lower microrotation values near misfit dislocation lines. Introduction of solute leads to a heterogeneous distribution of microrotation values with atoms near certain misfit nodes and misfit dislocations exhibiting large microrotation magnitudes while atoms near other nodes have microrotation magnitudes close to zero. This again suggests differing resistances to misfit dislocation glide due to misfit dislocation/solute configurations formed as a result of the random distribution of solutes. The 0% solute concentration model has a uniform distribution of energy barriers and as a result, applied strain leads to uniform misfit dislocation glide. Whether the local resistance to glide depends primarily on the local solute content will be discussed later. The second main observation is that the magnitude of the microrotation vector seems to increase with the presence of solutes. This is observed by the brighter regions near misfit nodes for the models containing solutes and suggests that increased atomic restructuring accompanies interface sliding in those models.
Visual inspection of these microrotation vector maps is not, however, sufficient for analyzing the deformation of the interface structures. Instead, numerical analysis of the microrotation vector distribution over several strain steps can characterize factors such as the degree of uniformity for interface sliding or degrees of atomic restructuring associated with interface sliding with relation to the overall solute concentration. An example of such analysis is the relationship between the microrotation vector magnitudes for atoms at misfit nodes and the interface deformation. This is done by selecting atoms with microrotation vector magnitudes greater than 0.06 and grouping them together using a KMeans clustering algorithm. Each cluster of atoms can then be assigned to a specific node by finding the minimum distance between the atom cluster and the misfit node centroid calculated via the previously described excess volume analysis. These clusters of deformed atoms are only mapped if their centroids differ by at most the node displacement to ensure that only atoms participating in misfit node glide are isolated. The filter value of 0.06, slightly less than 0.07 which has been shown in the literature to correspond to full dislocation glide [@Tucker_2011], is selected as it is the minimum cutoff which cleanly isolates misfit nodes that have undergone some amount of displacement. That it is slightly less than the value for full dislocation glide suggests that certain atoms at misfit dislocation nodes may not fully transition between separate atomic structures. This may be the case for an atom that remains within the region of high atomic structure distortion, resulting from the strain fields associated with misfit nodes, before and after the misfit node displacement.
 {#fig:micro_analysis}
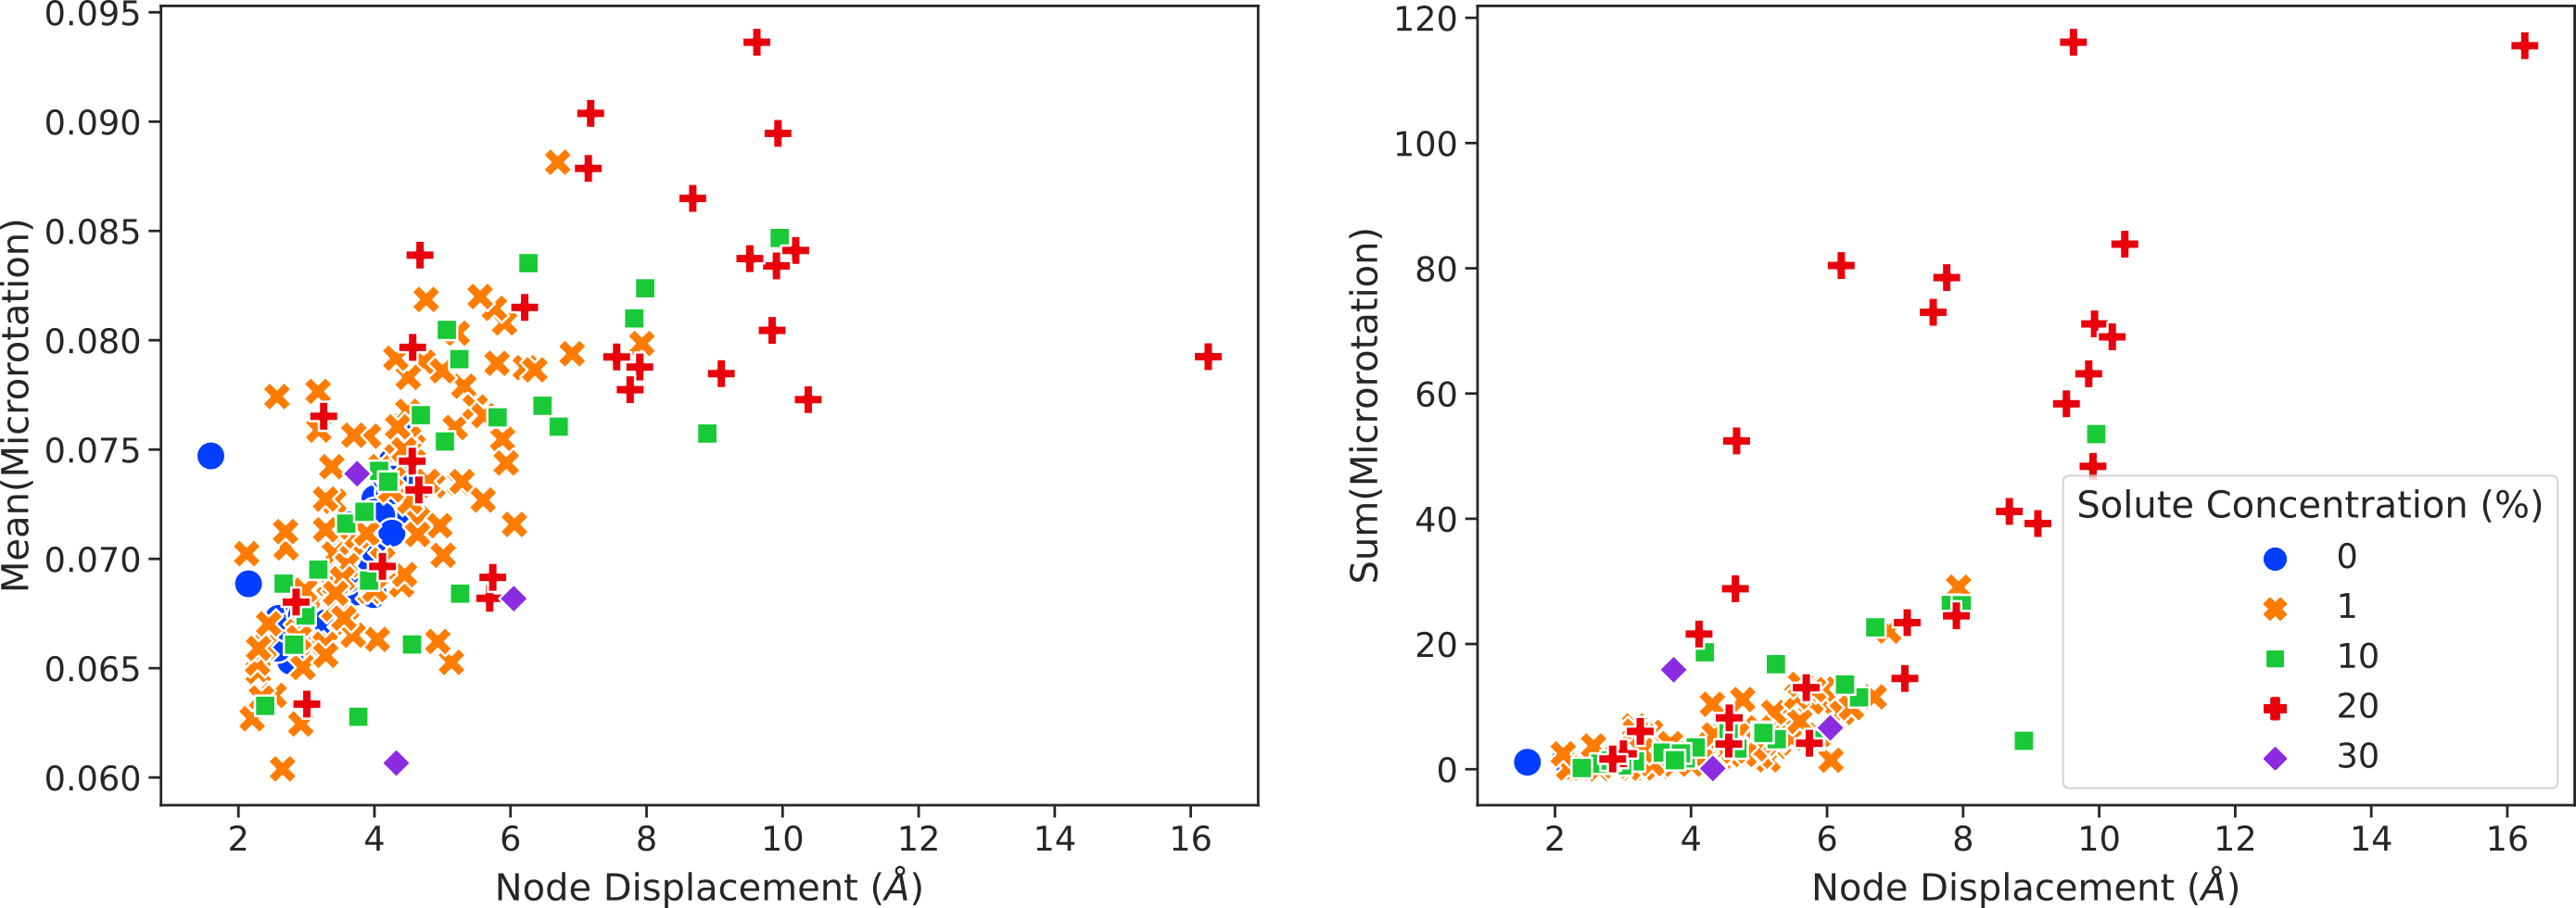
The relationship between both the average and sum of the microrotation vector magnitudes for atoms deformed by misfit node glide are shown in [@fig:micro_analysis]. The average atomic microrotation vector magnitude at a node and its displacement exhibits a clear positive correlation. Larger node displacements lead to the sweeping over of larger regions by misfit nodes as they glide, increasing the atoms which have undergone the full deformation process associated with interface sliding. Smaller node displacements lead to smaller swept areas and atoms at the glide front may end up in the misfit node core, undergoing only a portion of the atomic structure change associated with interface sliding. The summed microrotation vector magnitude presented in [@fig:micro_analysis] confirms this argument more clearly by the larger values noted at larger displacements. It also shows that the 20% solute concentration model tends to exhibit the larger sums for any given node displacement which may be related to the reduced shear strength noted compared to the other geometries. This is discussed in more detail in the following section. While there is a clear relationship between the microrotation at a node and its displacement, a large spread in values is still noted. Analysis of the solute fractions for atoms which are deformed by the glide of a misfit node can provide insight into whether the local solute environment causes either the spread in the misfit node displacements observed or the spread in the microrotation values for a given node displacement. As shown in [@fig:solute_relationship], the local solute environment does not correlate strongly with either the average node microrotation or the node displacement. This suggests that local misfit node glide does not occur independently and is instead coupled to the configuration formed between the entire misfit pattern and the solute atoms. Characterization of these configurations through more complex atomic structure analysis such as the smooth overlap of atomic positions (SOAP) metric [@Bart_k_2013].
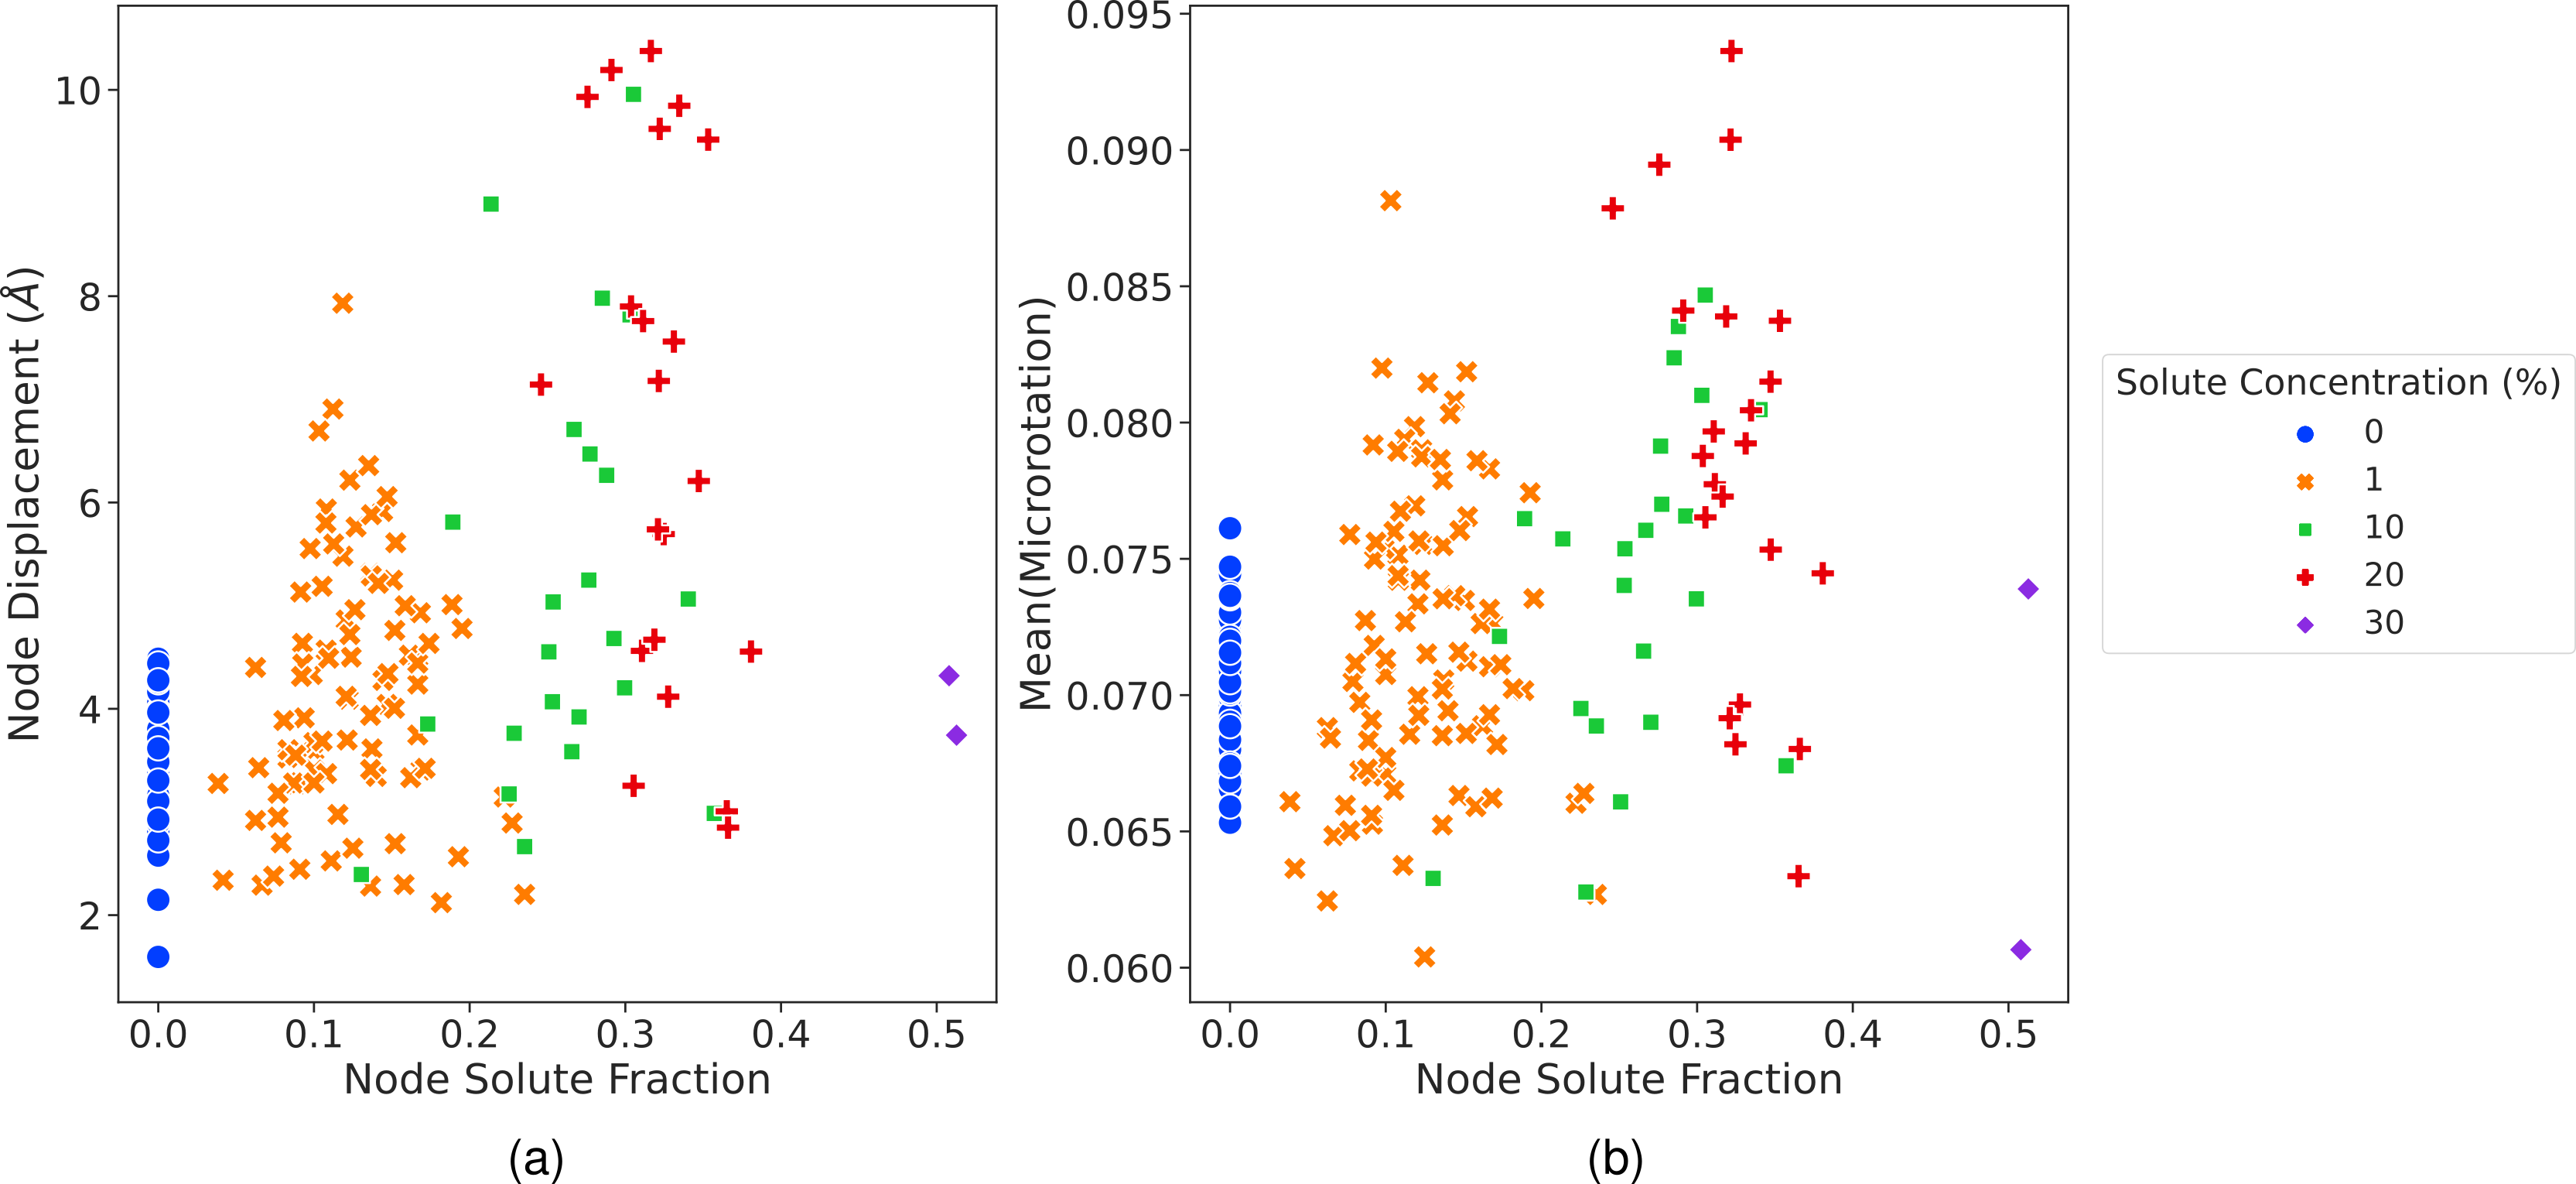 {#fig:solute_relationship}
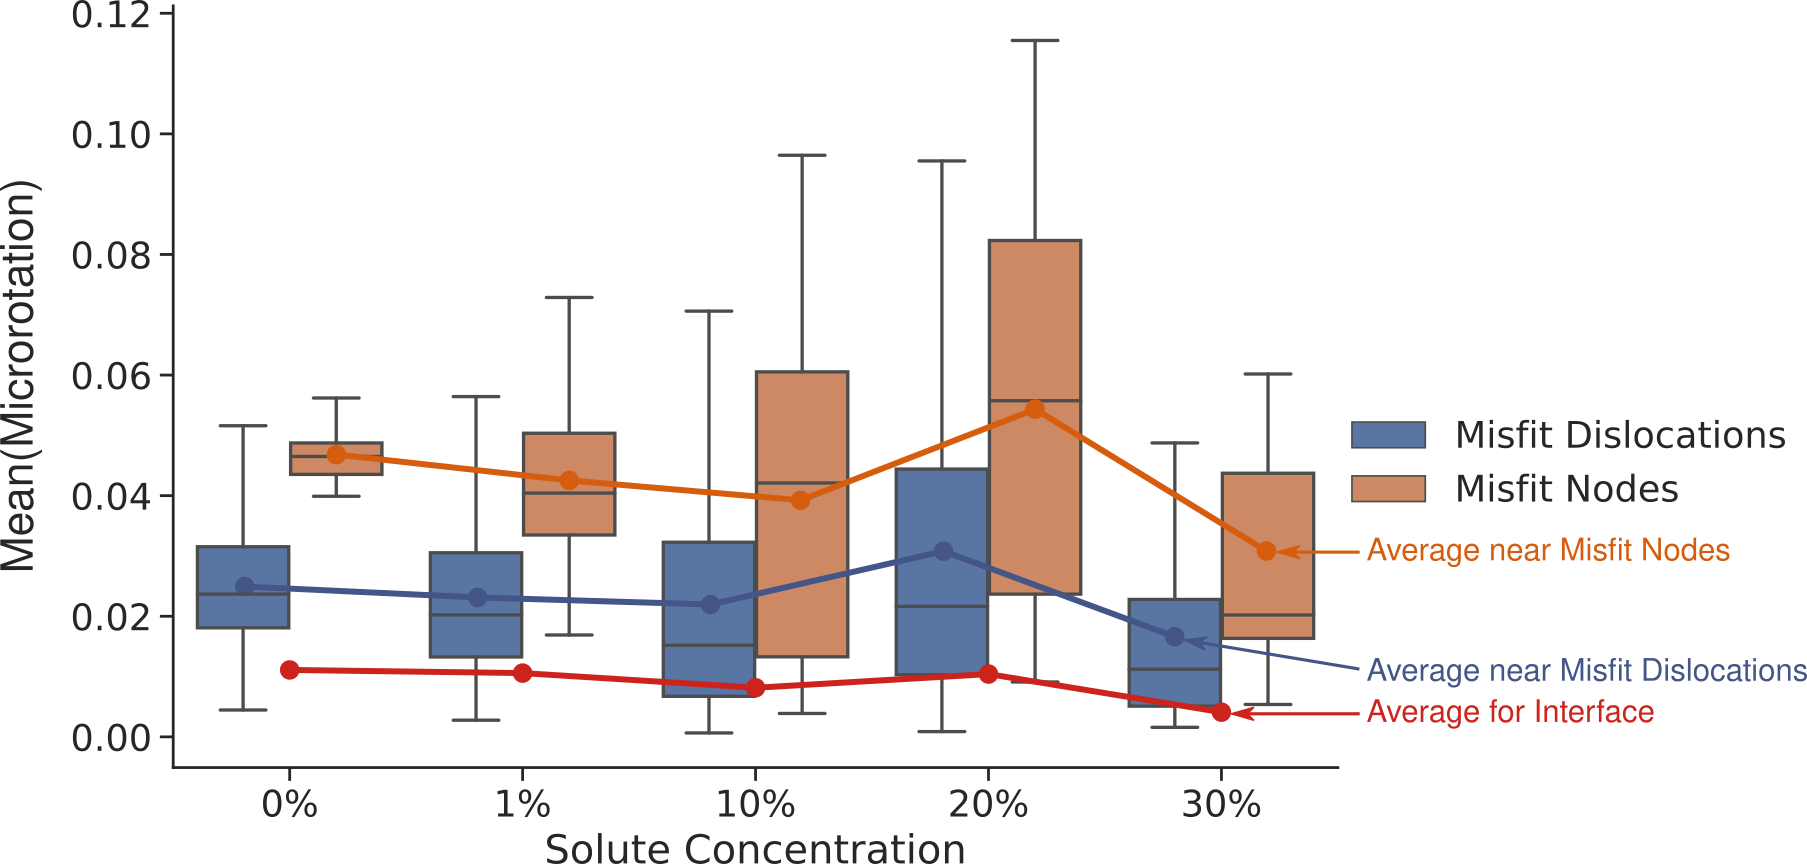
The focus so far has been on quantifying misfit node glide and the associated deformation; however, glide of misfit dislocations is also expected to occur. To quantify and compare the deformation of misfit dislocations and misfit nodes, average microrotation vector magnitudes in atomic neighborhoods surround points along the misfit dislocation lines and the misfit nodes. These atomic neighborhoods are calculated using the same methodology as used to calculate the solute fractions in [@fig:solute_fractions]. The distribution of averaged microrotation vector magnitudes over several strain increments are then plotted as box plots and shown in [@fig:mean_micro_frac]. The distribution of average microrotation vector magnitudes shows that misfit nodes are the primary sites of interface structure deformation while misfit dislocations are secondary sites. Both of these are higher than the interface average as expected. This trend matches the expected deformation pathway of Cu/Ni semi-coherent interfaces, which has been shown to initiate at misfit nodes and then progress along the misfit dislocation lines [@Chen_2018]. An increase in the spread of values accompanies the increase in solute concentration which has previously discussed to result from the piecewise interface sliding of subsets of misfit nodes. Not only does the atomic deformation associated with misfit node glide increase, measured through the increase in the microrotation values, so too does the atomic deformation associated with misfit dislocations themselves. The 0% and 1% models exhibit very similar microrotation distributions for atoms near misfit dislocations. Further increases to the solute fraction lead to increasing microrotation for atoms near misfit dislocations with the 20% solute concentration model exhibiting the largest values. This analysis reveals a transition from primarily misfit node glide to a combination of misfit dislocation and misfit node glide with increasing solute concentration.
 {#fig:mean_micro_frac}
Qualitative comparisons of energy barriers for interface sliding
Conclusions
Acknowledgements
This work is based on research supported by the National Science Foundation under the Grants CMMI-1761553 and CMMI-1761512. All presented simulations were conducted using XSEDE resources under the allocation TG-MSS150010.
\newpage